Chapter 8 HLA Typing & Neoantigens
Tumor mutations can result in altered proteins, which might act as neoantigens and potentially elicit an immune response. Algorithms, such as those available in pVAC-Tools can be used to predict neoantigen peptides.
In order to elicit an adaptive immune response, a peptide must be presented on a cell’s surface bound to major histocompatibility (MHC) protein complexes. The human leukocyte antigen (HLA) complex on chromosome 6 encodes most of the proteins that make up the human MHCs. The HLA complex is highly polymorphic and encodes MHCs that have different propensities to present different peptides. Two major classes of human MHC, class I and class II, (encoded by HLA-I and HLA-II alleles, respectively) are involved in antigen presentation. MHC class I protein complexes are expressed on all normal cells and present internally degraded proteins, while MHC class II protein complexes are normally expressed on professional antigen-presenting cells and present processed external antigens. The antigen binding portions of the MHC class I protein complexes are encoded by the HLA-I genes HLA-A, HLA-B and HLA-C. The antigen binding portions of the MHC class II proteins are encoded by alpha (A) and beta (B) genes in the DP, DQ and DR regions of the HLA complexes. These HLA-II genes include HLA-DQA1, HLA-DQB1 and HLA-DRB1.
Neoantigen prediction algorithms usually integrate peptide/MHC binding predictions using tools such as NetMHCpan, MHCflurry, and SMMalign. Knowing the HLA type is necessary to identify potential neoantigens for targeted immunotherapy. Current alignment-based HLA typing methods require DNA or RNA sequencing inputs and predict HLA-I class only or both of HLA-I and HLA-II classes. For example, arcasHLA, HLAProfiler, and seq2HLA have been developed to perform high-solution HLA typing from RNA-seq data. OptiType and PHLAT are other HLA identification tools for RNA, whole-exome, and whole-genome sequencing data. HLA reference sequences can be obtained from the ImMunoGeneTics (IMGT) database.
8.1 Identify HLA type
HLA Typing is a part of the neoantigen prediction module of RIMA.
RIMA uses arcasHLA to predict HLA types for both MHC Class I & Class II from the bulk RNA-seq data. The sorted alignment BAM files generated by STAR are used for input to arcasHLA. Here we use one sample from the Zhao trial as an example. We first extract the HLA reads from the alignment file:
### Extract fastq reads
arcasHLA extract analysis/STAR/SRR8281218/SRR8281218.sorted.bam -t 16 -v --sample SRR8281218 -o analysis/neoantigen/SRR8281218

### Output from extraction
analysis/neoantigen/SRR8281218/SRR8281218.extracted.1.fq.gz
analysis/neoantigen/SRR8281218/SRR8281218.extracted.2.fq.gz
Then we identify the HLA alleles using the extracted reads:
arcasHLA genotype analysis/neoantigen/SRR8281218/SRR8281218.extracted.1.fq.gz analysis/neoantigen/SRR8281218/SRR8281218.extracted.2.fq.gz -g A,B,C,DQA1,DQB1,DRB1 -t 16 -v -o analysis/neoantigen/SRR8281218

###Output from extraction
analysis/neoantigen/SRR8281218/SRR8281218.genotype.json
cat analysis/neoantigen/SRR8281218/SRR8281218.genotype.json

###
{"A": ["A*26:01:01", "A*03:01:01"], "B": ["B*35:01:01", "B*07:02:01"], "C": ["C*07:02:01", "C*04:01:01"], "DQA1": ["DQA1*02:01:01", "DQA1*03:01:01"], "DQB1": ["DQB1*03:02:01"], "DRB1": ["DRB1*04:02:01", "DRB1*07:01:01"]}
###
Merge individual HLAs
RIMA also merges the individual HLA results from arcasHLA into a summary file named ‘genotypes.tsv’:
subject A1  A2  B1  B2  C1  C2  DQA11   DQA12   DQB11   DQB12   DRB11   DRB12
SRR8281238  A*01:01:01  A*02:01:01  B*35:01:01  B*08:01:01  C*07:01:01  C*04:01:01  DQA1*05:01:01   DQA1*01:01:01   DQB1*02:01:01   DQB1*05:01:01   DRB1*01:01:01   DRB1*03:01:01
SRR8281233  A*01:01:01  A*02:01:01  B*57:01:01  B*44:02:01  C*05:01:01  C*06:02:01  DQA1*01:02:01   DQA1*03:01:01   DQB1*06:02:01   DQB1*03:02:01   DRB1*04:01:01   DRB1*15:01:01
SRR8281236  A*33:01:01  A*24:02:01  B*14:02:01  B*15:01:01  C*06:02:01  C*08:02:01  DQA1*01:02:02   DQA1*03:01:01   DQB1*03:02:01   DQB1*05:02:01   DRB1*04:03:01   DRB1*16:02:01
SRR8281243  A*01:01:01  A*24:02:01  B*35:02:01  B*41:01:01  C*04:01:01  C*17:01:01  DQA1*01:02:01   DQA1*01:05:01   DQB1*05:01:01   DQB1*06:09:01   DRB1*10:01:01   DRB1*13:02:01
SRR8281251  A*24:02:01  A*01:01:01  B*35:02:01  B*41:01:01  C*04:01:01  C*17:01:01  DQA1*01:02:01   DQA1*01:05:01   DQB1*05:01:01   DQB1*06:09:01   DRB1*10:01:01   DRB1*13:02:01
SRR8281230  A*01:01:01  A*02:01:01  B*57:01:01  B*44:02:01  C*05:01:01  C*06:02:01  DQA1*03:01:01   DQA1*01:02:01   DQB1*03:02:01   DQB1*06:02:01   DRB1*04:01:01   DRB1*15:01:01
SRR8281250  A*01:01:01  A*02:01:01  B*35:01:01  B*08:01:01  C*07:01:01  C*04:01:01  DQA1*05:01:01   DQA1*01:01:01   DQB1*02:01:01   DQB1*05:01:01   DRB1*01:01:01   DRB1*03:01:01
SRR8281244  A*25:01:01  A*02:01:01  B*18:01:01  B*08:01:01  C*07:02:01  C*12:03:01  DQA1*01:02:01   DQA1*01:02:01   DQB1*06:02:01   DQB1*06:02:01   DRB1*15:01:01   DRB1*15:01:01
SRR8281218  A*26:01:01  A*03:01:01  B*35:01:01  B*07:02:01  C*07:02:01  C*04:01:01  DQA1*02:01:01   DQA1*03:01:01   DQB1*03:02:01   DQB1*03:02:01   DRB1*04:02:01   DRB1*07:01:01
8.2 HLA Oncoplot
To better visualize and compare the HLA distribution in different samples, we use arcasHLA to convert HLA results to P-group format. The P-group format shows the alleles which share the same amino acid sequence in the antigen-binding region. (eg. A*01:01P, ‘P’ indicates p-group nomenclature)
###
#HLA summary file: genotypes.tsv
arcasHLA convert -r p-group genotypes.tsv -o genotypes.p-group.tsv
###
subject A1 A2 B1 B2 C1 C2 DQA11 DQA12 DQB11 DQB12 DRB11 DRB12
SRR8281233 A*01:01P A*02:01P B*57:01P B*44:02P C*05:01P C*06:02P DQA1*01:02P DQA1*03:01P DQB1*06:02P DQB1*03:02P DRB1*04:01P DRB1*15:01P
SRR8281236 A*33:01P A*24:02P B*14:02P B*15:01P C*06:02P C*08:02P DQA1*01:02P DQA1*03:01P DQB1*03:02P DQB1*05:02P DRB1*04:03P DRB1*16:02P
SRR8281243 A*01:01P A*24:02P B*35:02P B*41:01P C*04:01P C*17:01P DQA1*01:02P DQA1*01:01P DQB1*05:01P DQB1*06:09P DRB1*10:01P DRB1*13:02P
SRR8281244 A*25:01P A*02:01P B*18:01P B*08:01P C*07:02P C*12:03P DQA1*01:02P DQA1*01:02P DQB1*06:02P DQB1*06:02P DRB1*15:01P DRB1*15:01P
SRR8281250 A*01:01P A*02:01P B*35:01P B*08:01P C*07:01P C*04:01P DQA1*05:01P DQA1*01:01P DQB1*02:01P DQB1*05:01P DRB1*01:01P DRB1*03:01P
SRR8281219 A*03:01P A*26:01P B*35:01P B*07:02P C*07:02P C*04:01P DQA1*02:01P DQA1*03:01P DQB1*03:02P DQB1*03:03P DRB1*04:02P DRB1*07:01P
SRR8281245 A*25:01P A*02:01P B*18:01P B*08:01P C*07:02P C*12:03P DQA1*01:02P DQA1*01:02P DQB1*06:02P DQB1*06:02P DRB1*15:01P DRB1*15:01P
SRR8281230 A*01:01P A*02:01P B*57:01P B*44:02P C*05:01P C*06:02P DQA1*03:01P DQA1*01:02P DQB1*06:02P DQB1*03:02P DRB1*04:01P DRB1*15:01P
SRR8281251 A*24:02P A*01:01P B*35:02P B*41:01P C*04:01P C*17:01P DQA1*01:02P DQA1*01:01P DQB1*05:01P DQB1*06:09P DRB1*10:01P DRB1*13:02P
SRR8281218 A*26:01P A*03:01P B*35:01P B*07:02P C*07:02P C*04:01P DQA1*02:01P DQA1*03:01P DQB1*03:02P DQB1*03:02P DRB1*04:02P DRB1*07:01P
SRR8281238 A*01:01P A*02:01P B*35:01P B*08:01P C*07:01P C*04:01P DQA1*05:01P DQA1*01:01P DQB1*02:01P DQB1*05:01P DRB1*01:01P DRB1*03:01P
SRR8281226 A*33:01P A*24:02P B*14:02P B*15:01P C*06:02P C*08:02P DQA1*03:01P DQA1*01:02P DQB1*05:02P DQB1*03:02P DRB1*04:03P DRB1*16:02PRIMA generates an HLA oncoplot which shows the most frequent HLA alleles across patient cohorts and the expression level of HLA genes (HLA-A, HLA-B, HLA-C, HLA-DQA1, HLA-DQB1, and HLA-DRB1). The percentages on the left of the heatmap represent the frequency of the allele among samples. The colors in the heatmap indicate which allele (e.g. A = HLA-A) and whether the allele was found in the first (A1), the second (A2) or both copies of the patient’s gene. The colored bars to the right indicate the absolute number of alleles found. The x axis represents patient samples. The samples are sorted by group and then by the expression of HLA genes within the group. The HLA expression shown on the top represents the mean TPM of HLA genes in each sample.
#load HLA p-group summary file
hla <- read.table("genotypes.p-group.tsv", header = TRUE, sep = "\t")
#load metasheet
meta <- read.table("metasheet.csv", sep = ",", header = TRUE, row.names = 1)
#load gene expression matrix
exprn <- read.table("tpm_convertID.txt", header = TRUE, row.names = 1, sep = ",", check.names = FALSE)

source("hla_oncoplot.R")
#group indicates which columns are used for hla comparison
index <- c("Responder", "Gender")
p <- hla_oncoplot(hla, exprn, meta, groups = index)
## All mutation types: C2, DQA12, DQB11, DQB12, B1, C1, A2, A1, B2, DQA11,
## DRB11, DRB12.## `alter_fun` is assumed vectorizable. If it does not generate correct
## plot, please set `alter_fun_is_vectorized = FALSE` in `oncoPrint()`.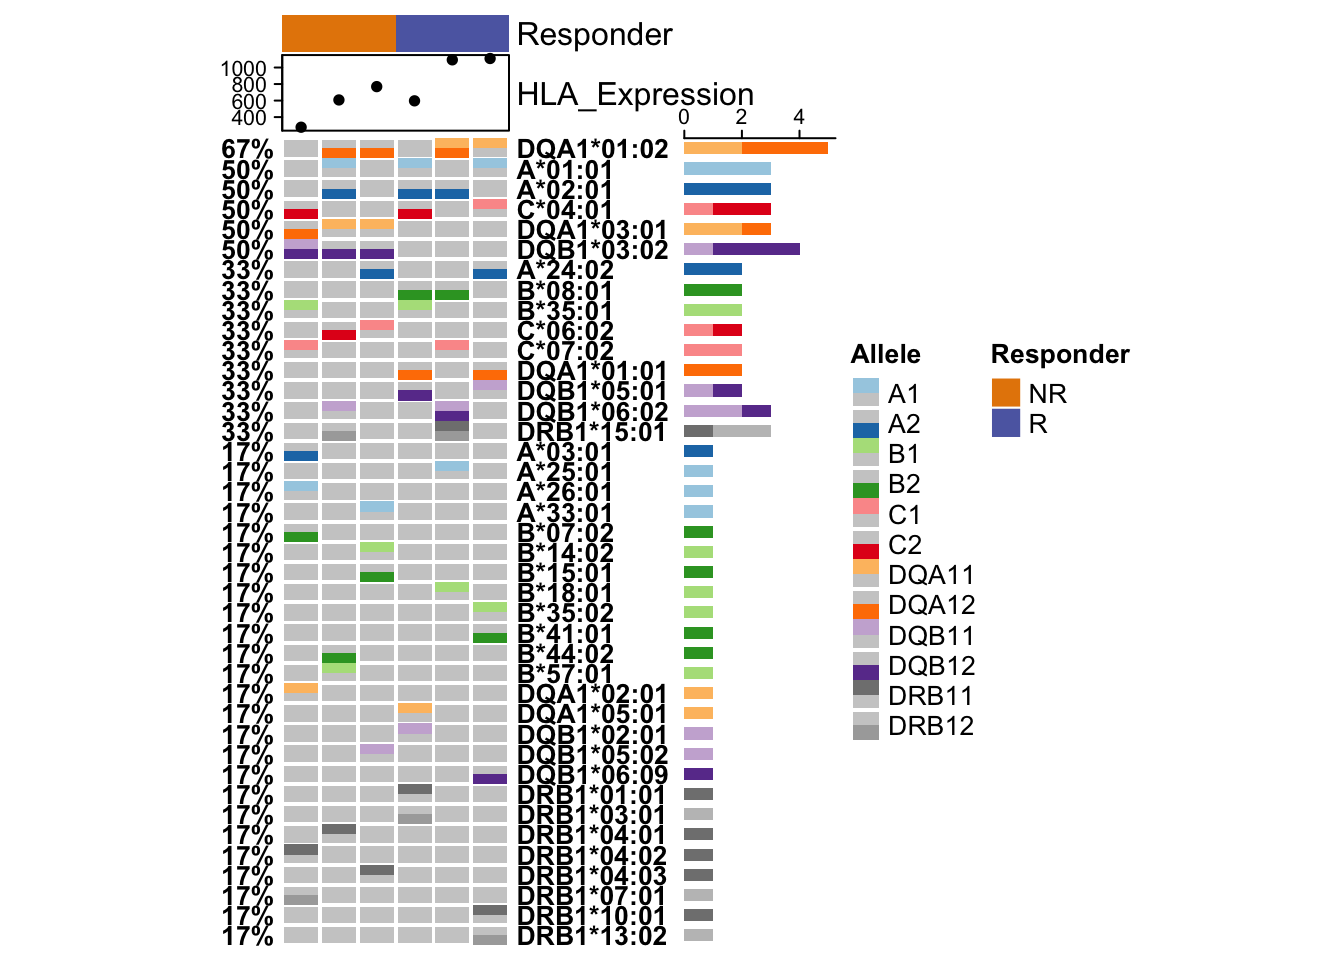
8.3 Neoantigen Identification
To identify neoantigens, we will need the somatic mutation and HLA allele information introduced in previous sub-chapters. The standard approach for somatic mutation detection is the analysis of whole-exome (WES) or whole-genome sequencing data from tumor-normal matched pairs. Computational algorithms are used to call mutations from the resulting data. For example, MuTect is based on a Bayesian classifier, MuSE is based on a Bayesian Markov model, SomaticSniper is based on a Bayesian comparison of genotype likelihoods, and Varscan2 is based on a heuristic algorithm classifying somatic status. Among these approaches, Varscan2 can be applied to RNA-seq data with good coverage, although the mutation calls are still expected to be noisier than those from DNA sequencing. After somatic mutation detection, VEP can be used to annotate mutations on genes, transcripts, and regulatory regions. Sinee it’s not common to have deep-sequenced tumor-normal paired samples, current RIMA is not supporting the function of calling somatic mutation from RNA-seq data. In this chapter, we are showing the example of identifying expressed neoantigens integrating both RNA-seq and WES data.
Here we use one matched tumor-normal sample for both RNA and WES of the same patient from the Zhao trial as an example. We use RIMA preprocessing module to get the Salmon gene quantification SRR7588416.format.quant.sf. We use the WES pipeline to process the tumor fastq reads (SRR7588416) and matched normal fastqs (SRR7588421): Somatic Mutation is being called using Sentieon Somatic Caller to output a VCF file. Next, we annotate the VCF file with Ensembl Variant Effect Predictor (VEP) . SRR7588416_tnscope.neoantigen.vep.vcf is the example of VEP annotated VCF output. The ‘vcf-expression-annotator’ tool from pVAC-Tools can be used to add the expression information from the outputs obtained from Salmon. This will add “TX” (i.e Transcript Expression) tag to the ‘FORMAT’ column of the VCF output SRR7588416_tnscope.neoantigen.vep.rna.vcf. Optitype and xHLA are used to get the MHC Class I&II allels results. SRR7588416_result_optitype.tsv and SRR7588416_result_xHLA.json stores HLA alleles results respectively.
After generating the somatic hypermutation with expression information, and MHC class I&II alleles, we used ‘pvacseq run’ command to estimate the peptide binding affinity to predicted HLAs. SRR7588416.all_epitopes.tsv is th example results of MCH Class I&II peptides with length ranges from 8 to 18 predicted by NetMHCpan and NetMHCIIpan. SRR7588416.all_epitopes.aggregated.tsv is the aggreagated results of the best-scoring (lowest binding affinity) epitope. Detailed information of columns in each output file can be found here.