Chapter 6 Immune Infiltration
Cell infiltration estimation in the tumor microenvironment
The tumor microenviroment (TME) is a complicated system consisting of immune cells, stromal cells, and extracellular factors. Estimating cell components is essential for classifying the distinct tumor immune microenvironment (TIME) phenotype. Furthermore, dissecting the TIME by evaluating cell components plays a significant role in untangling the mechanisms of tumor progression and immune evasion.
Traditionally, there have been two major approaches for estimating cell infiltration in the TME – 1) deconvolution-based and 2) marker-based approaches. Deconvolution-based methods, such as TIMER, quanTIseq, EPIC, and CIBERSORT, consider a given gene expression profile as a linear combination of pre-defined immune gene signatures present at different ratios. A linear regression model is often applied to estimate the coefficients of genes, which are later used to infer immune cell abundances or fractions. Marker-based approaches, such as xCell and MCP-counter, quantify the signature enrichment score of a list of cell-specific marker genes from gene expression profiles. ImmuneDeconv is an R package that implements these six algorithms. All six algorithms estimate cell infiltration of immune cells, while three of the algorithms also estimate stromal cells. EPIC and quanTIseq also assess uncharacterized cells defined as cancer cells. Of note, CIBERSORT absolute mode, EPIC, and quanTIseq support inter-comparison between sample groups and intra-comparison between cell types. TIMER, xCell, and MCP-counter only support inter-comparison between sample groups within the same cell type. Immune cell deconvolution is still an open question in the field, and different algorithms could give slightly different results. A user may wish to evaluate the consistency of predictions stemming from different algorithms, the agreement of results with estimations from other modalities, and/or the derivation of the marker genes used for the tool. Newer algorithms are being developed which can utilize single-cell RNA-seq data as reference and which attempt to impute cell type-specific gene expression. These tools may improve predictions, especially if a well-annotated and compatible reference is available.
6.1 Cibersort
Note: RIMA uses Cibersort in the immune_infiltration modules. Use of Cibersort requires registration for use of their gene signature matrix. In order to run the immune_infiltration module of RIMA, you must register and download the LM22.txt matrix from the CIBERSORT website . Once you obtain this file, add it to the ~/RIMA/RIMA_pipeline/static/cibersort folder.
CIBERSORT is a deconvolution-based method that uses the v-support vector regression method (v-SVR) to estimate each immune cell type’s relative proportion from a gene expression profile (GEP). It requires an input of reference gene expression signatures. CIBERSORT provides a gene signature matrix (LM22.txt) which contains 547 genes and distinguishes 7 T-cell types, naïve and memory B cells, plasma cells, and NK cells. The CIBERSORT absolute mode scales cellular fractions to a score that reflects each cell type’s absolute proportion, allowing comparison across both samples and cell types.
The CIBERSORT source code and LM22 signature matrix are only freely available to academic users – register for access on the CIBERSORT website .
To run CIBERSORT using ImmuneDeconv:
#demo
suppressMessages(library(immunedeconv))
#read gene expression matrix
input <- "tpm_convertID.txt"

#load CIBERSORT source code and signature matrix
source("CIBERSORT.R")
sig_matrix <- "LM22.txt"

#Run CIBERSORT abs
#The number of permutation
cibersort_perm = 100
#Quantile normalization of input mixture, default = FALSE for RNA-Seq data
cibersort_qn = FALSE
#whether to apply absolute mode in cibersort
cibersort_abs = TRUE
#sig.score = for each mixture sample, define S as the median expression,level of all genes in the signature matrix divided by the median expression level of all genes in the mixture. Multiple cell subset fractions by S.
cibersort_abs_method = "sig.score"
res_ciber <- CIBERSORT(sig_matrix, input, perm = cibersort_perm, QN = cibersort_qn, absolute = cibersort_abs,
                       abs_method = cibersort_abs_method)

head(res_ciber,3)
## B cells naive B cells memory Plasma cells T cells CD8
## SRR8281218 0.002023271 0.003060637 0.000000000 0.12297118
## SRR8281219 0.010693087 0.000000000 0.001201108 0.38499197
## SRR8281226 0.000000000 0.008281786 0.000000000 0.01442307
## T cells CD4 naive T cells CD4 memory resting
## SRR8281218 0 0.14975225
## SRR8281219 0 0.22216858
## SRR8281226 0 0.08219228
## T cells CD4 memory activated T cells follicular helper
## SRR8281218 0 0.08924869
## SRR8281219 0 0.16924345
## SRR8281226 0 0.06671124
## T cells regulatory (Tregs) T cells gamma delta NK cells resting
## SRR8281218 0.09617560 0 0.06763887
## SRR8281219 0.00000000 0 0.00000000
## SRR8281226 0.04296535 0 0.07211706
## NK cells activated Monocytes Macrophages M0 Macrophages M1
## SRR8281218 0.0000000 0.06195550 0.0000000 0.01550602
## SRR8281219 0.1076938 0.03659288 0.1552708 0.03207925
## SRR8281226 0.0357515 0.41486727 0.0000000 0.00000000
## Macrophages M2 Dendritic cells resting Dendritic cells activated
## SRR8281218 0.7049077 0 0.000000000
## SRR8281219 1.1589577 0 0.000000000
## SRR8281226 0.6474766 0 0.004669831
## Mast cells resting Mast cells activated Eosinophils Neutrophils
## SRR8281218 0.11994310 0 0.003766691 0.00000000
## SRR8281219 0.24218289 0 0.000000000 0.07942792
## SRR8281226 0.01289667 0 0.002926060 0.12361329
## P-value Correlation RMSE Absolute score (sig.score)
## SRR8281218 0.07 0.15699314 1.027475 1.436950
## SRR8281219 0.24 0.05195861 1.072383 2.600503
## SRR8281226 0.08 0.13503937 1.054532 1.5288926.2 TIMER
TIMER (Tumor IMmune Estimation Resource) uses linear least square regression to estimate six tumor-infiltrating immune cell types (B, CD4T, CD8T, neutrophils, macrophages, and dendritic cells). Since the tumor purity is very different across different cancer cell types, TIMER selects specific genes as immune signatures based on the correlation between gene expression and tumor purity. (see Bo Li, et al. for more information.
Tutorial of TIMER’s web interface:
Tutorial of TIMER2:
Note that the TIMER score can only be compared within samples, and the current version of TIMER supports 23 different TCGA cancer types.
#load gene expression matrix
df <- read.table(input, sep = ",", row.names = 1, header = TRUE, check.names = FALSE)

#The TCGA cancer acronyms of demo data
cancertype <- "GBM"
#Available cancer type
immunedeconv::timer_available_cancers
res_timer = as.data.frame(deconvolute(df, "timer",indications=rep(tolower(cancertype),ncol(df))))
6.3 quanTIseq
quanTIseq uses constrained least square regression to estimate absolute proportions of the infiltration levels of 10 immune cell types from RNA seq data. Therefore, the score of quanTIseq allows inter- or intra-sample comparison. quanTIseq provides an entire pipeline that can either process the pre-computed gene expression matrix (TPM matrix) or directly analyze bulk RNA-Seq data. RIMA uses the TPM matrix generated in the proprocessing modules for all immune infiltration algorithms.
6.4 xCell
xCell performs single-sample gene set enrichment analysis (ssGSEA) on expression data to evaluate the enrichment of immune marker genes. These marker genes were validated using cytometry immunophenotyping and in-silico simulations. Note that results of xCell depend on the number of samples. The power of estimation might be lower if your dataset has limited non-heterogeneous samples.
6.5 EPIC
EPIC uses constrained least square regression to estimate six immune cell types, fibroblasts, and endothelial cells. EPIC collects a unique gene expression reference from circulating and tumor-infiltrating cells. Further, it extended its algorithm to evaluate the uncharacterized cancer cells. The score that comes from the EPIC algorithm is an absolute value that can be compared within or across samples.
6.6 MCP-counter
MCP-counter uses its transcriptomic markers (TM) curated from 81 public datasets to estimate fibroblasts, endothelial cells, and eight immune cell types.
6.7 Starting with TPM matrix
immune_infiltration.R contains R scripts for immune infiltration comparison analysis using a TPM matrix as input. Below is an example of running the scripts to obtain CIBERSORT absolute results:
Rscript src/immune_infiltration/immune_infiltration.R -e exprsn -t cancer_type -p permutation -q FALSE -a TRUE -m abs_method -o out_dir

Usage:
  -e expression file [Required]
  -o output directory [Required]
  -p permutation for cibersort
  -q whether enable quantile normalization for cibersort TRUE/FALSE
  -a whether enable absolute mode of cibersort TRUE/FALSE
  -m absolute method for cibersort_abs Default: 'sig.score'
  -t cancer type for timer
RIMA will generate immune infiltration results for all six algorithms which can be used to compare immune cell levels between phenotypes. After RIMA’s immune_infiltration module is run, text output files as well as boxplot, correlation and heatmap plots are stored in the analysis/immune_infiltration folder of the RIMA_pipeline. Example code is provided below for heatmap and boxplots like those generated by RIMA. CIBERSORT abs results are used as an example. If you wish to use this code to generate new figures, set “phenotype” in the hmap and boxfig calls to the appropriate column in metasheet.csv.
6.7.1 Correlation Plots
RIMA generates correlation plots for 8 cell types. (B cells, CD4 T cells, CD8 Tcells, DCs, Macrophages, Treg cells, NK cells and Neutrophils) These image files display Spearman correlation values for all six algorithms, allowing you to compare cell estimations between algorithms.
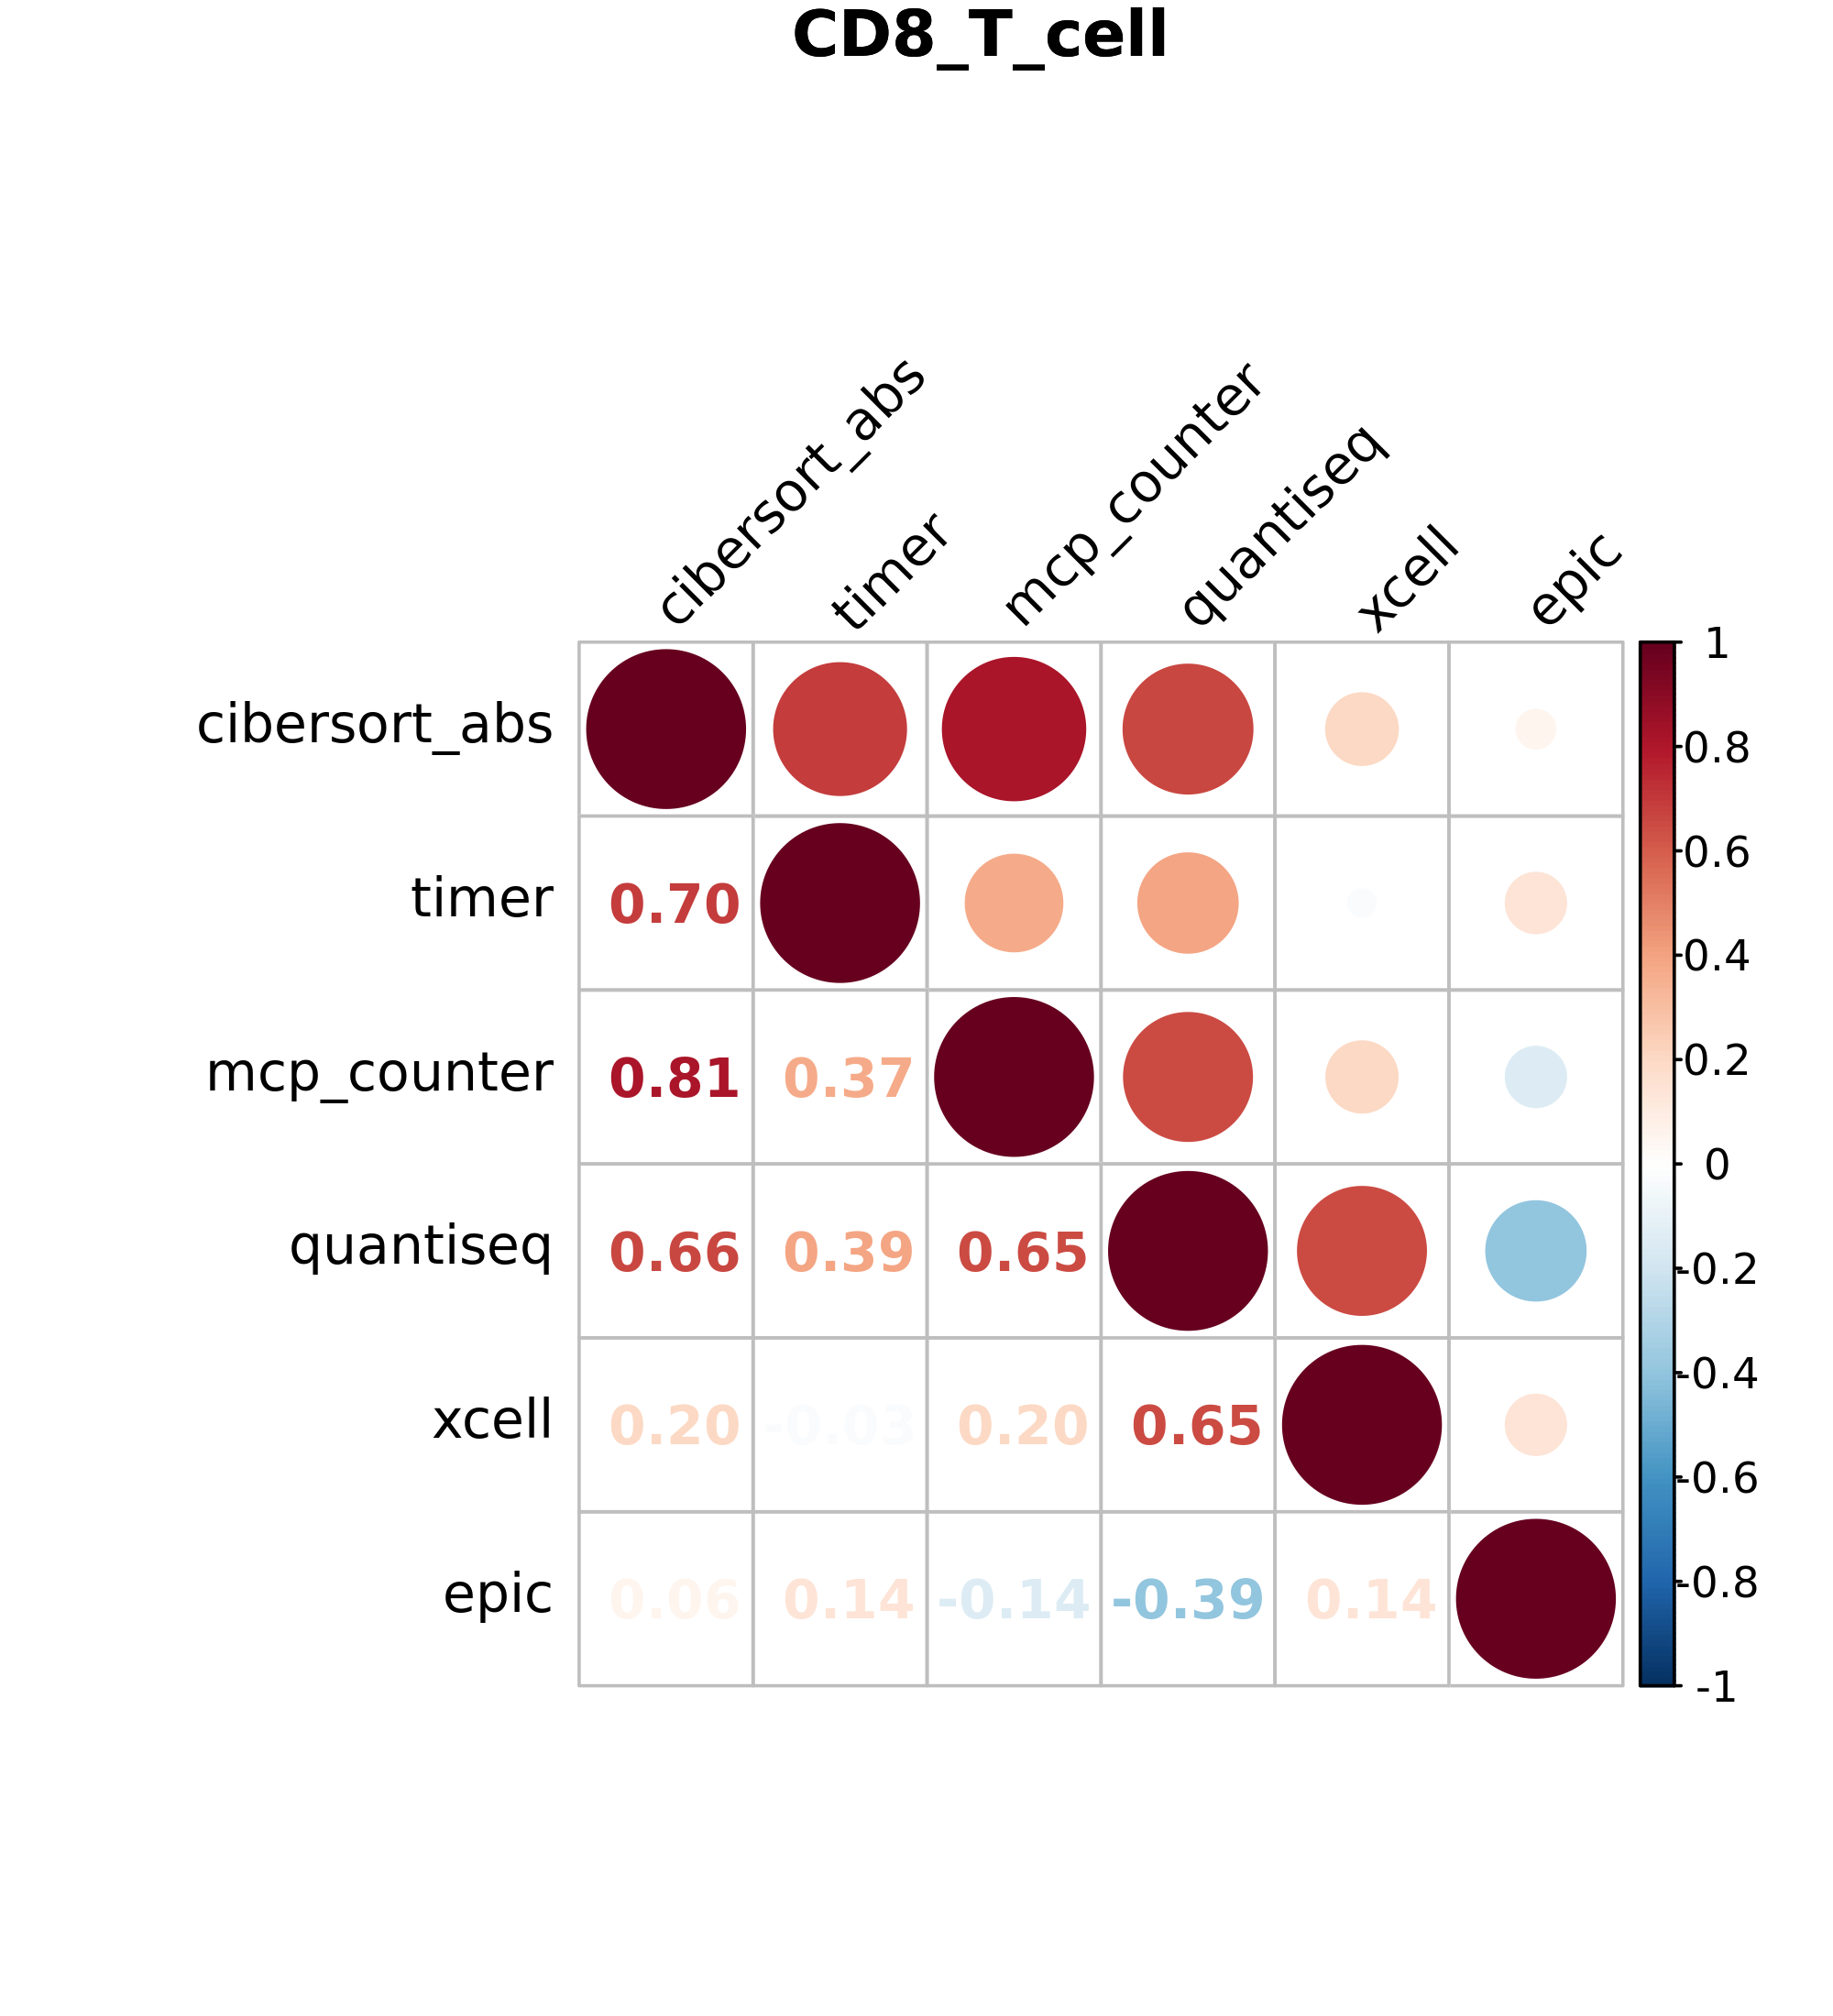
Figure 6.1: Volcano plot
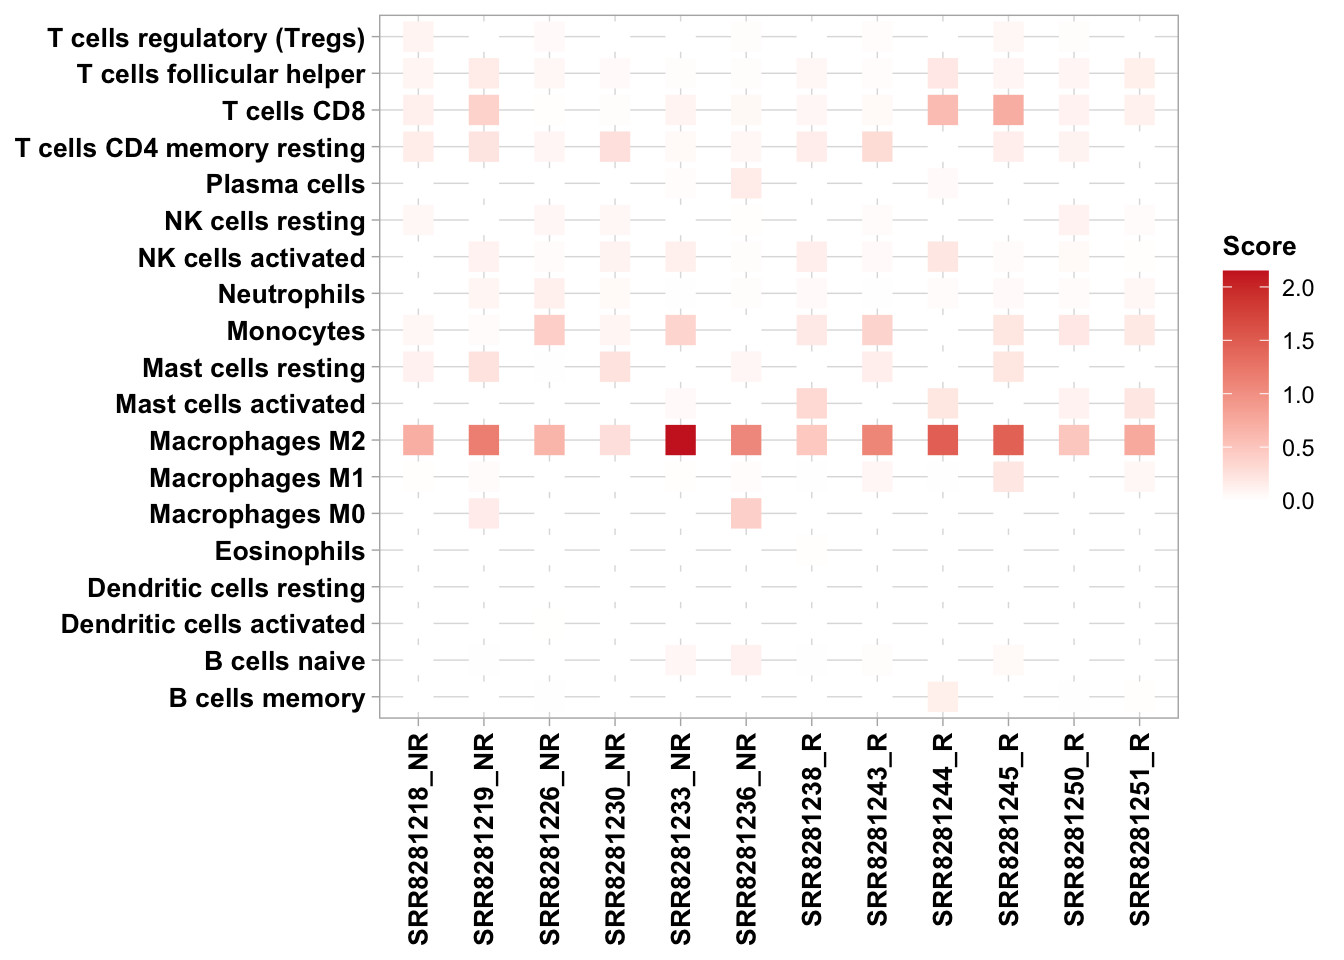
6.7.2 Heatmaps for comparisons across cell types
##            B cells naive B cells memory Plasma cells T cells CD8
## SRR8281218   0.002023271    0.003060637  0.000000000  0.12297118
## SRR8281219   0.010693087    0.000000000  0.001201108  0.38499197
## SRR8281226   0.000000000    0.008281786  0.000000000  0.01442307
## SRR8281236   0.119197082    0.000000000  0.175028807  0.05841897
## SRR8281230   0.000000000    0.001725996  0.000000000  0.02099308
## SRR8281233   0.074569126    0.000000000  0.022548328  0.09612605
## SRR8281244   0.000000000    0.133329588  0.041170411  0.58644201
## SRR8281245   0.057960600    0.000000000  0.001729094  0.71691961
## SRR8281243   0.021015715    0.000000000  0.000000000  0.05560813
## SRR8281251   0.000000000    0.014652173  0.000000000  0.12265135
## SRR8281238   0.010961877    0.000000000  0.000000000  0.07328546
## SRR8281250   0.000000000    0.007211828  0.000000000  0.11124637
##            T cells CD4 naive T cells CD4 memory resting
## SRR8281218                 0               0.1497522454
## SRR8281219                 0               0.2221685808
## SRR8281226                 0               0.0821922827
## SRR8281236                 0               0.0616983261
## SRR8281230                 0               0.2636255094
## SRR8281233                 0               0.0540161771
## SRR8281244                 0               0.0000000000
## SRR8281245                 0               0.1346463483
## SRR8281243                 0               0.2983063326
## SRR8281251                 0               0.0008469304
## SRR8281238                 0               0.1462044340
## SRR8281250                 0               0.0912421429
##            T cells CD4 memory activated T cells follicular helper
## SRR8281218                            0                0.08924869
## SRR8281219                            0                0.16924345
## SRR8281226                            0                0.06671124
## SRR8281236                            0                0.02097714
## SRR8281230                            0                0.04434860
## SRR8281233                            0                0.01702242
## SRR8281244                            0                0.20198021
## SRR8281245                            0                0.08491094
## SRR8281243                            0                0.02547211
## SRR8281251                            0                0.13107578
## SRR8281238                            0                0.06549731
## SRR8281250                            0                0.08310786
##            T cells regulatory (Tregs) T cells gamma delta NK cells resting
## SRR8281218                0.096175601                   0       0.06763887
## SRR8281219                0.000000000                   0       0.00000000
## SRR8281226                0.042965351                   0       0.07211706
## SRR8281236                0.016105425                   0       0.01389437
## SRR8281230                0.003663422                   0       0.06303278
## SRR8281233                0.000000000                   0       0.00000000
## SRR8281244                0.000000000                   0       0.00000000
## SRR8281245                0.064756411                   0       0.00000000
## SRR8281243                0.024209477                   0       0.02796011
## SRR8281251                0.000000000                   0       0.03345416
## SRR8281238                0.000000000                   0       0.00000000
## SRR8281250                0.021319048                   0       0.11199972
##            NK cells activated    Monocytes Macrophages M0 Macrophages M1
## SRR8281218         0.00000000 0.0619555028      0.0000000   0.0155060204
## SRR8281219         0.10769382 0.0365928767      0.1552708   0.0320792458
## SRR8281226         0.03575150 0.4148672695      0.0000000   0.0000000000
## SRR8281236         0.01814658 0.0009746492      0.4032181   0.0265143088
## SRR8281230         0.09185887 0.0765481976      0.0000000   0.0007397341
## SRR8281233         0.12935356 0.3642042042      0.0000000   0.0146104309
## SRR8281244         0.20599738 0.0000000000      0.0000000   0.0111442172
## SRR8281245         0.03120120 0.2150193255      0.0000000   0.2086448744
## SRR8281243         0.04129983 0.3731328017      0.0000000   0.0712853735
## SRR8281251         0.01556184 0.1857497242      0.0000000   0.0649557029
## SRR8281238         0.13490224 0.1832561460      0.0000000   0.0058262672
## SRR8281250         0.05657334 0.2021661178      0.0000000   0.0026188791
##            Macrophages M2 Dendritic cells resting Dendritic cells activated
## SRR8281218      0.7049077            0.0000000000               0.000000000
## SRR8281219      1.1589577            0.0000000000               0.000000000
## SRR8281226      0.6474766            0.0000000000               0.004669831
## SRR8281236      1.0709844            0.0000000000               0.000000000
## SRR8281230      0.2730022            0.0005978992               0.000000000
## SRR8281233      2.1503686            0.0000000000               0.000000000
## SRR8281244      1.4746127            0.0000000000               0.000000000
## SRR8281245      1.4430364            0.0000000000               0.000000000
## SRR8281243      1.0892152            0.0000000000               0.000000000
## SRR8281251      0.7517625            0.0000000000               0.000000000
## SRR8281238      0.4755445            0.0004518878               0.000000000
## SRR8281250      0.4947339            0.0000000000               0.003493596
##            Mast cells resting Mast cells activated Eosinophils Neutrophils
## SRR8281218         0.11994310           0.00000000 0.003766691 0.000000000
## SRR8281219         0.24218289           0.00000000 0.000000000 0.079427915
## SRR8281226         0.01289667           0.00000000 0.002926060 0.123613285
## SRR8281236         0.06937423           0.00000000 0.000000000 0.017959545
## SRR8281230         0.24554128           0.00000000 0.000000000 0.055268474
## SRR8281233         0.00000000           0.04839376 0.000000000 0.008407325
## SRR8281244         0.00000000           0.21527869 0.000000000 0.028385274
## SRR8281245         0.21885148           0.00000000 0.000000000 0.040372665
## SRR8281243         0.13542538           0.00000000 0.000000000 0.006578541
## SRR8281251         0.00000000           0.20693722 0.001084478 0.058856146
## SRR8281238         0.00000000           0.32409274 0.013953275 0.047135836
## SRR8281250         0.00000000           0.10459983 0.000000000 0.035923878
#load plotfunction
source("plotfunction.R")
#load metasheet for RIMA pipeline
metasheet <- read.csv("metasheet.csv")
#methods: CIBERSORT, quanTIseq, EPIC, MCP, xCell, TIMER
hmap(ta = res_ciber, meta = metasheet, methods = "CIBERSORT", phenotype = "Responder")